Findings
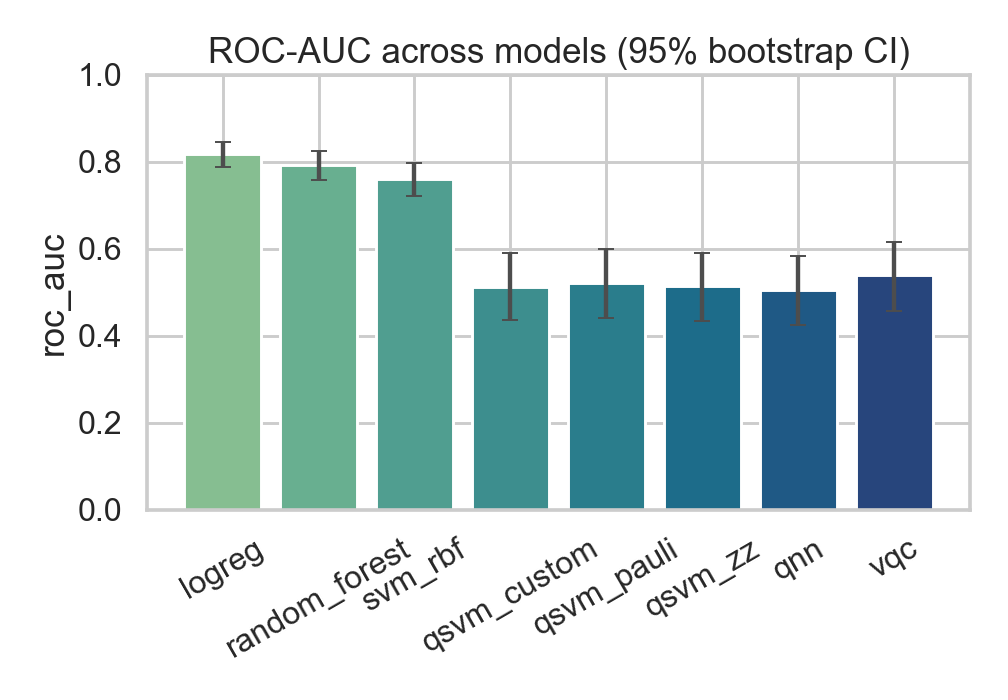
The benchmark trains three classical baselines and five quantum models on the same ICU mortality task, evaluates them on a held-out test set, and attaches a 95% bootstrap confidence interval to every metric. The result is a clean separation: the classical models carry real signal, and the quantum models, at this scale, do not.
Results
The table below is generated directly from reports/results.json by
scripts/build_docs_tables.py. No value here is typed by hand.
| Model | Type | Accuracy | Balanced acc. | ROC-AUC [95% CI] | PR-AUC | F1 | Train (s) |
|---|---|---|---|---|---|---|---|
| Logistic Regression | classical | 0.810 | 0.651 | 0.817 [0.787, 0.845] | 0.578 | 0.460 | 0.01 |
| Random Forest | classical | 0.808 | 0.646 | 0.792 [0.758, 0.824] | 0.540 | 0.451 | 0.54 |
| SVM (RBF) | classical | 0.812 | 0.631 | 0.759 [0.721, 0.796] | 0.532 | 0.420 | 1.10 |
| VQC | quantum | 0.520 | 0.520 | 0.540 [0.457, 0.616] | 0.567 | 0.556 | 77.50 |
| QSVM (Pauli Z+XX) | quantum | 0.520 | 0.520 | 0.522 [0.440, 0.600] | 0.518 | 0.543 | 174.46 |
| QSVM (ZZFeatureMap) | quantum | 0.535 | 0.535 | 0.513 [0.434, 0.590] | 0.518 | 0.551 | 104.08 |
| QSVM (custom feature map) | quantum | 0.490 | 0.490 | 0.513 [0.437, 0.591] | 0.513 | 0.474 | 36.96 |
| QNN (SamplerQNN) | quantum | 0.500 | 0.500 | 0.506 [0.425, 0.583] | 0.506 | 0.510 | 74.03 |
ROC-AUC is shown with its 95% bootstrap confidence interval. A model whose interval includes 0.5 is statistically indistinguishable from a coin flip on this test set.
Five honest takeaways
-
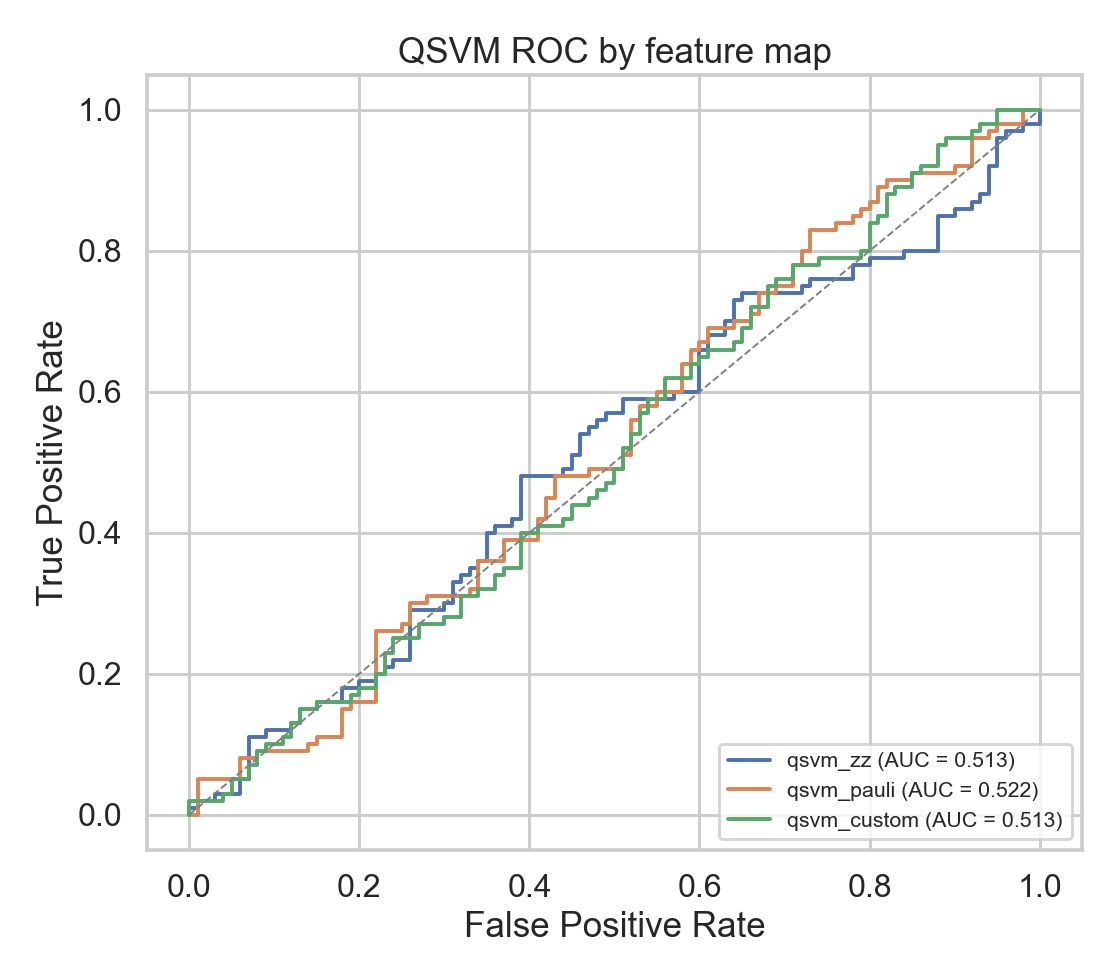
The quantum models are at chance. Every quantum model's ROC-AUC confidence interval includes 0.5. The strongest is the VQC at 0.540 [0.457, 0.616]; the QSVM variants land at 0.513 to 0.522 and the QNN at 0.506 [0.425, 0.583]. None clears the bar for a learned signal.
-
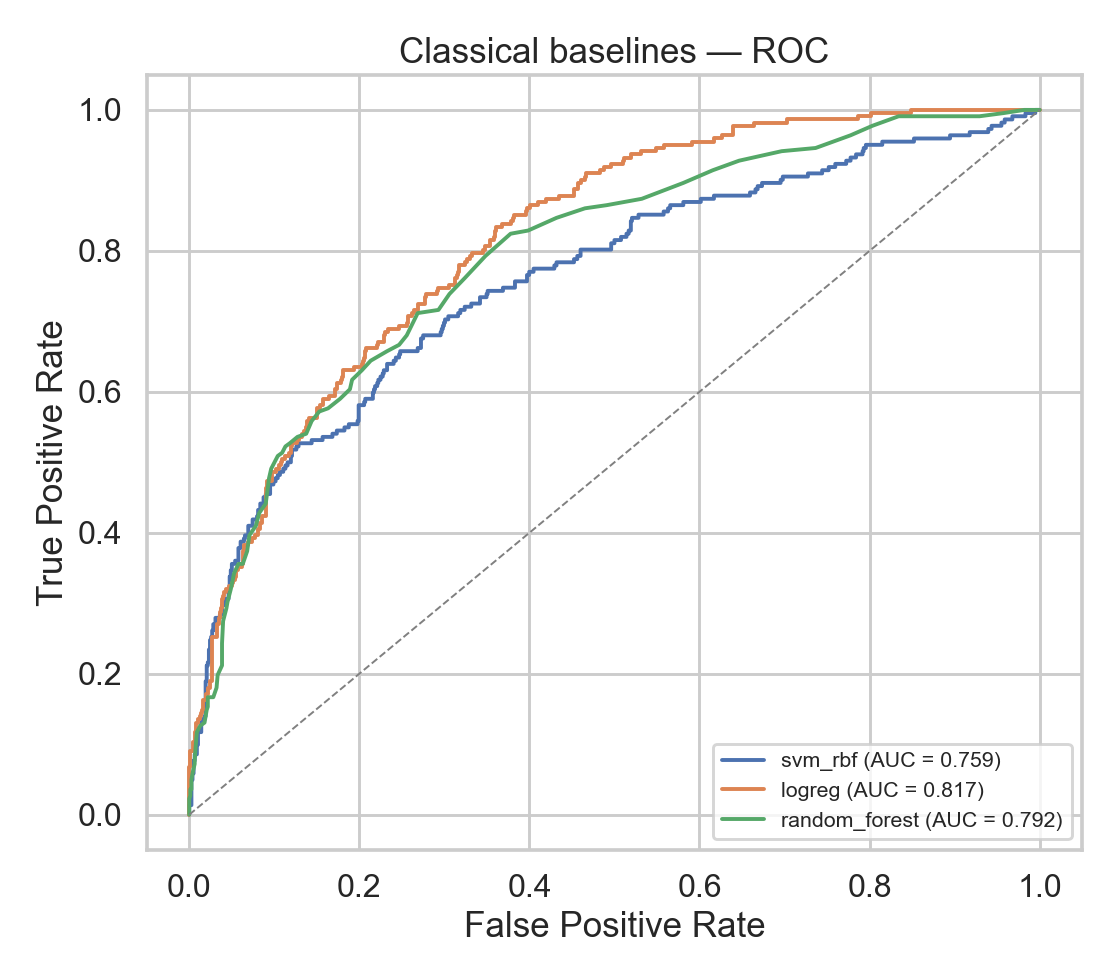
The classical baselines have stable, real signal. Logistic Regression reaches ROC-AUC 0.817 [0.787, 0.845], and 5-fold cross-validation agrees closely (0.810 plus or minus 0.013), so the single-split estimate is not a fluke. Random Forest (0.792) and SVM-RBF (0.759) behave similarly.
-
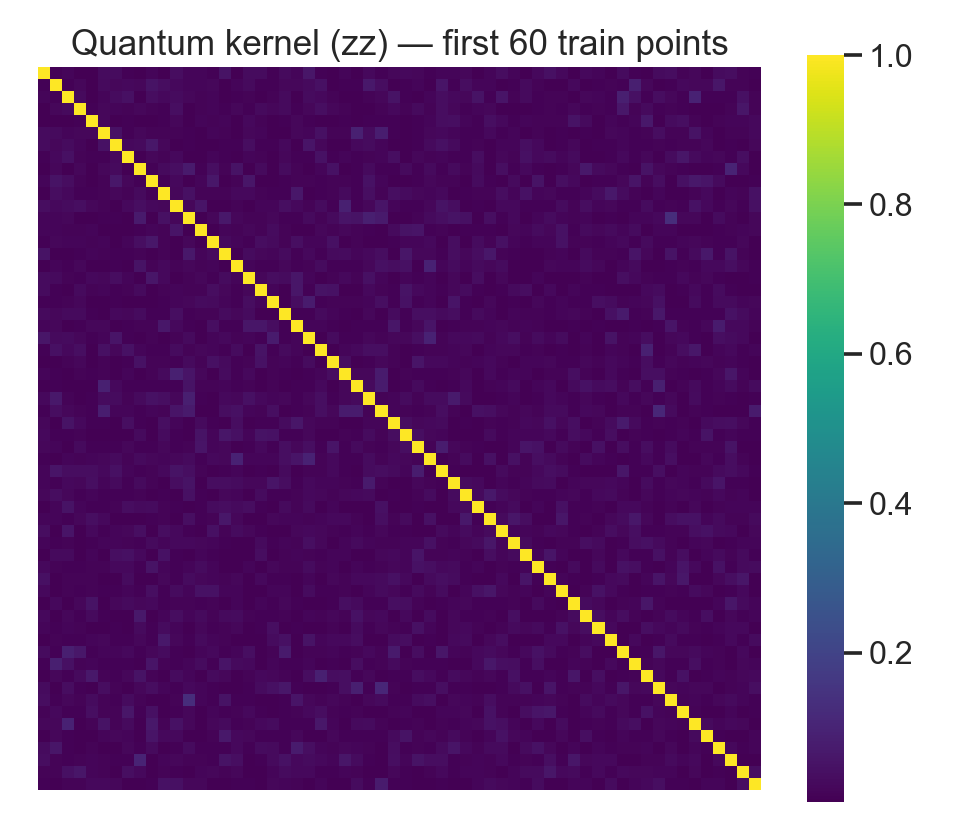
The feature-map choice is within noise. The three QSVM feature maps (ZZ, Pauli Z+XX, and the custom map) differ by about 0.01 ROC-AUC, well inside their confidence intervals. The fidelity kernel matrices are close to the identity at N=200, so there is little structure for the SVM to use.
-
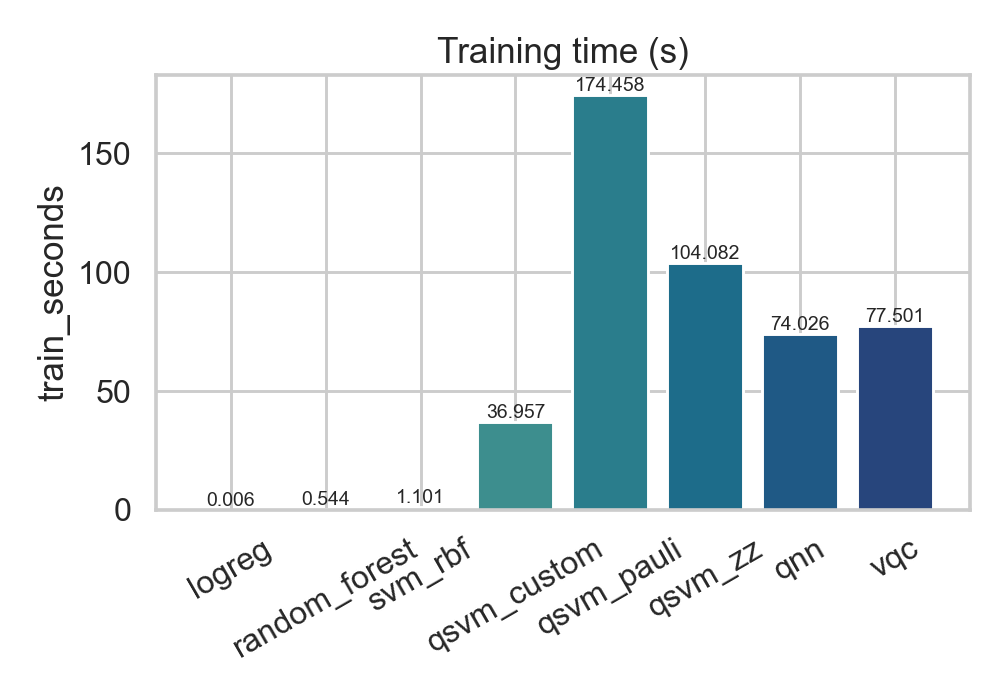
Runtime is the real bottleneck. Classical models train in 0.006 to 1.1 seconds. The quantum models take 37 to 174 seconds on a statevector simulator, two to four orders of magnitude slower, driven by the O(N squared) cost of the fidelity kernel.
-
The engineering carries forward. The result is a statement about this scale and this simulator, not about quantum machine learning in general. Liu, Arunachalam, and Temme (2021) identify regimes where quantum kernels are provably hard to simulate classically; the feature maps, fidelity kernel, PSD enforcement, and Qiskit primitives used here transfer directly to that setting.
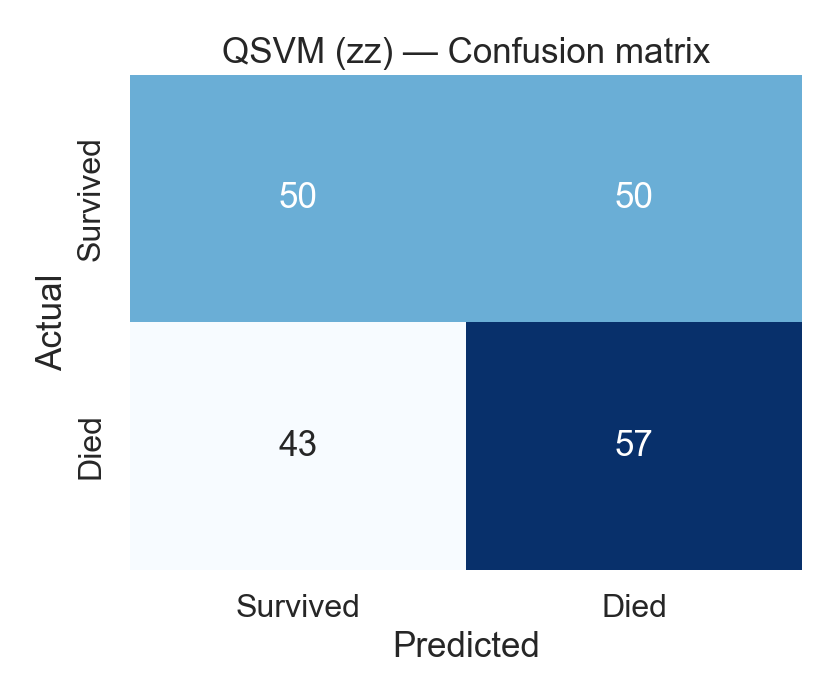
Confusion matrices and training curves
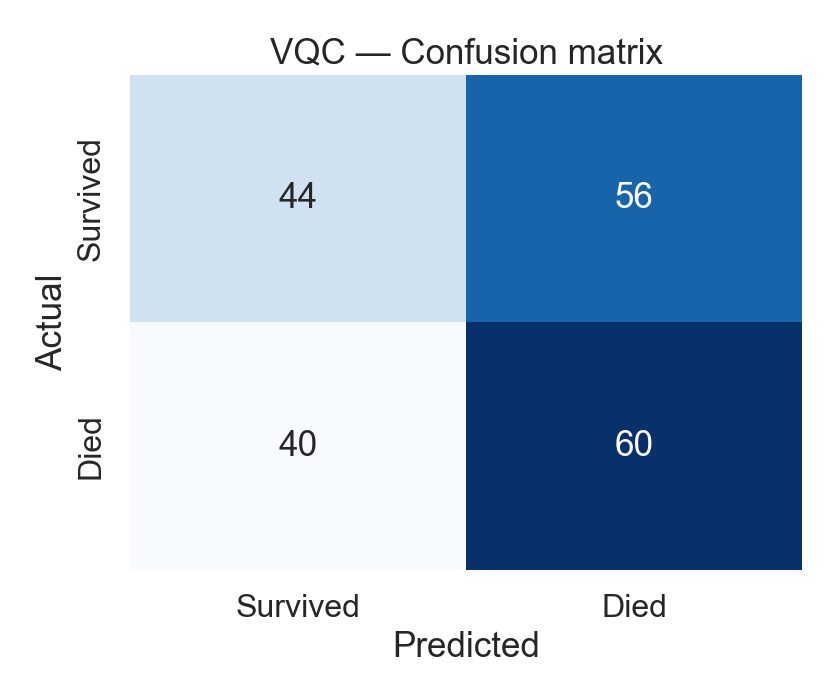
See Methodology for how each number is produced, or Limitations for what this benchmark does and does not claim.